Back to projects

I stopped designing reports
and built the system
that makes them

Every client wanted almost the same report. Never exactly the same one. And most of them wanted it broken down by a field I had never seen, because they had created it themselves.

UPilot is a sales CRM. I have been its design lead for over a decade, and reporting is the part I have rebuilt the most: three times in fifteen years.

The first version was a catalogue. We started with the reports our customers asked for most often, I designed them, we shipped them. Most of them were a real help to the people using them.

The rewrite that followed was still a catalogue, but a broader one, where a system had started to show through. Every metric came with the same set of breakdowns: per salesperson, per product, over time. Far more ground covered, far fewer screens to design.

The breakdowns, though, were still ours. We had decided which data mattered, and the request that kept coming back was always for the custom fields each client had added themselves. A catalogue cannot hold something that does not exist yet, however large it gets. Building that version is what showed me how to build the third.

So the work stopped being about reports. It became about the way to build one.

That never meant giving up the other half of the job: handing people what they need instead of leaving them to build it themselves.
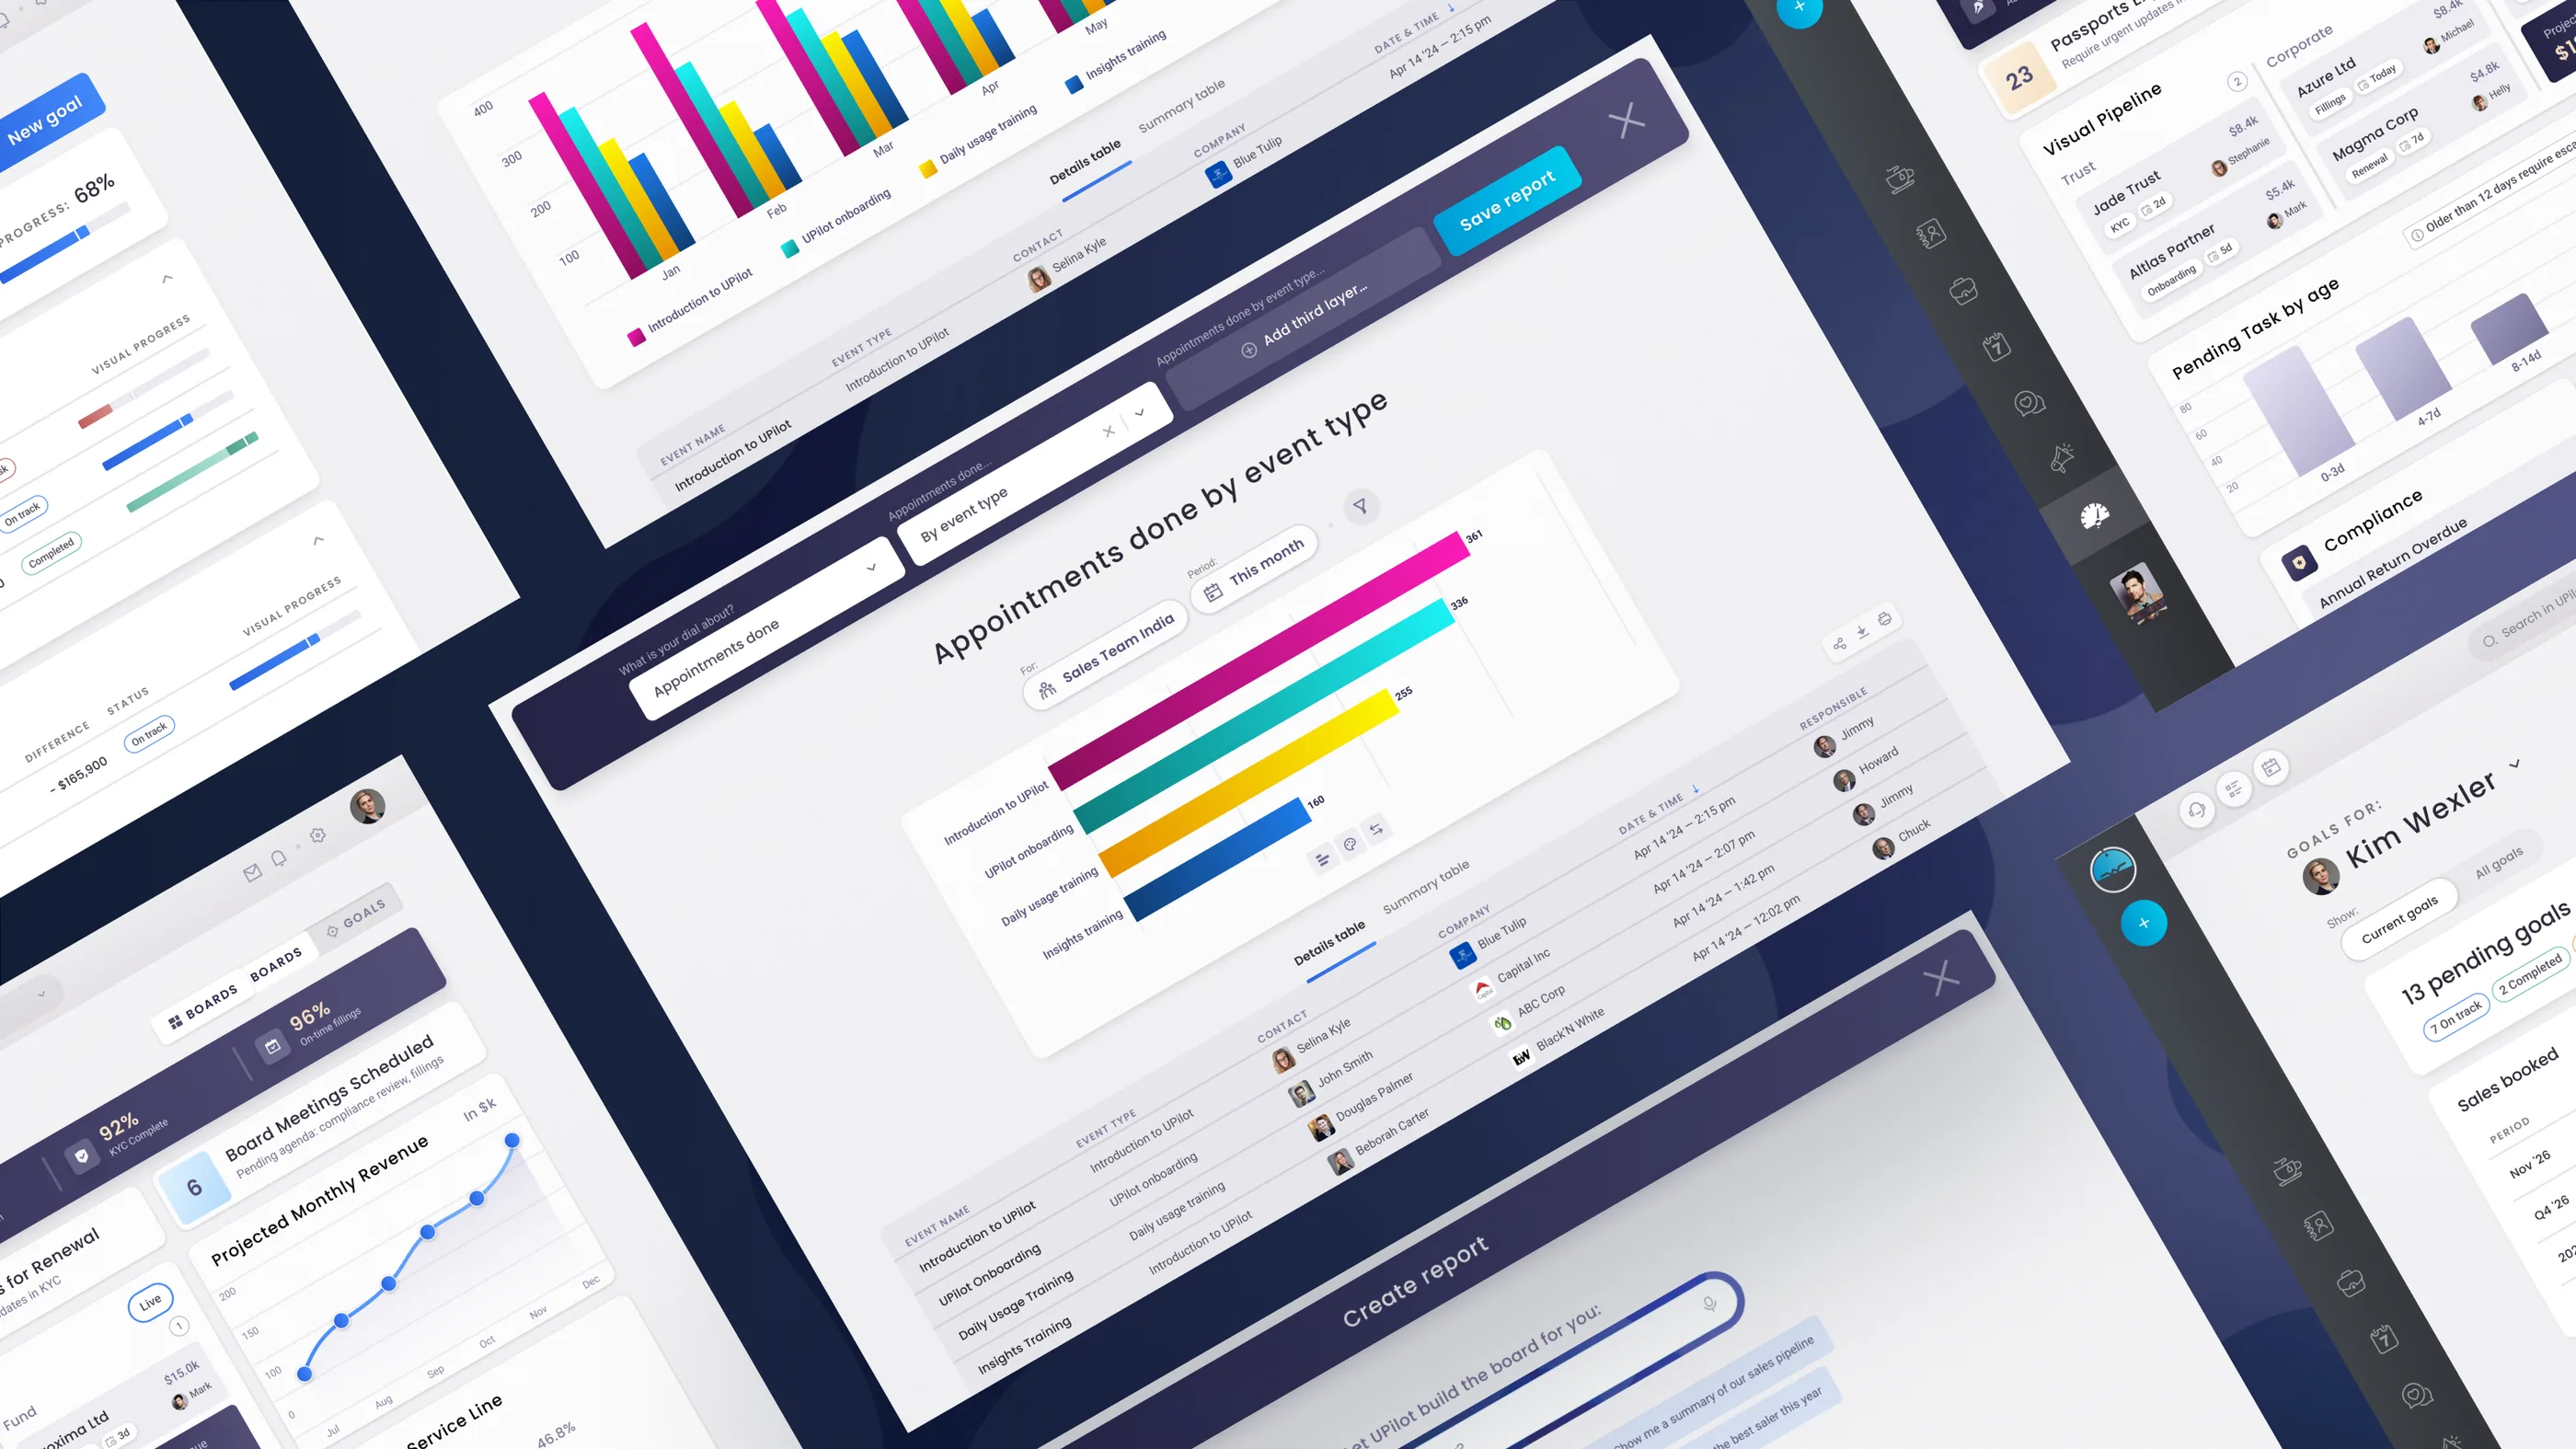
Several screens of the UPilot reporting module seen in perspective: a report being built, dashboards, and a goals screen

Why a step-by-step approach rather than drag and drop?

Drag and drop is a natural answer for technical people who already know their data and what they are looking for. For that kind of user, drag and drop really is a great way to build reports.

The reality for the vast majority of our clients was simpler: they did not always know what they needed, and they had no time to sit down and build it. Telling us what they were after and getting the chart back was faster.

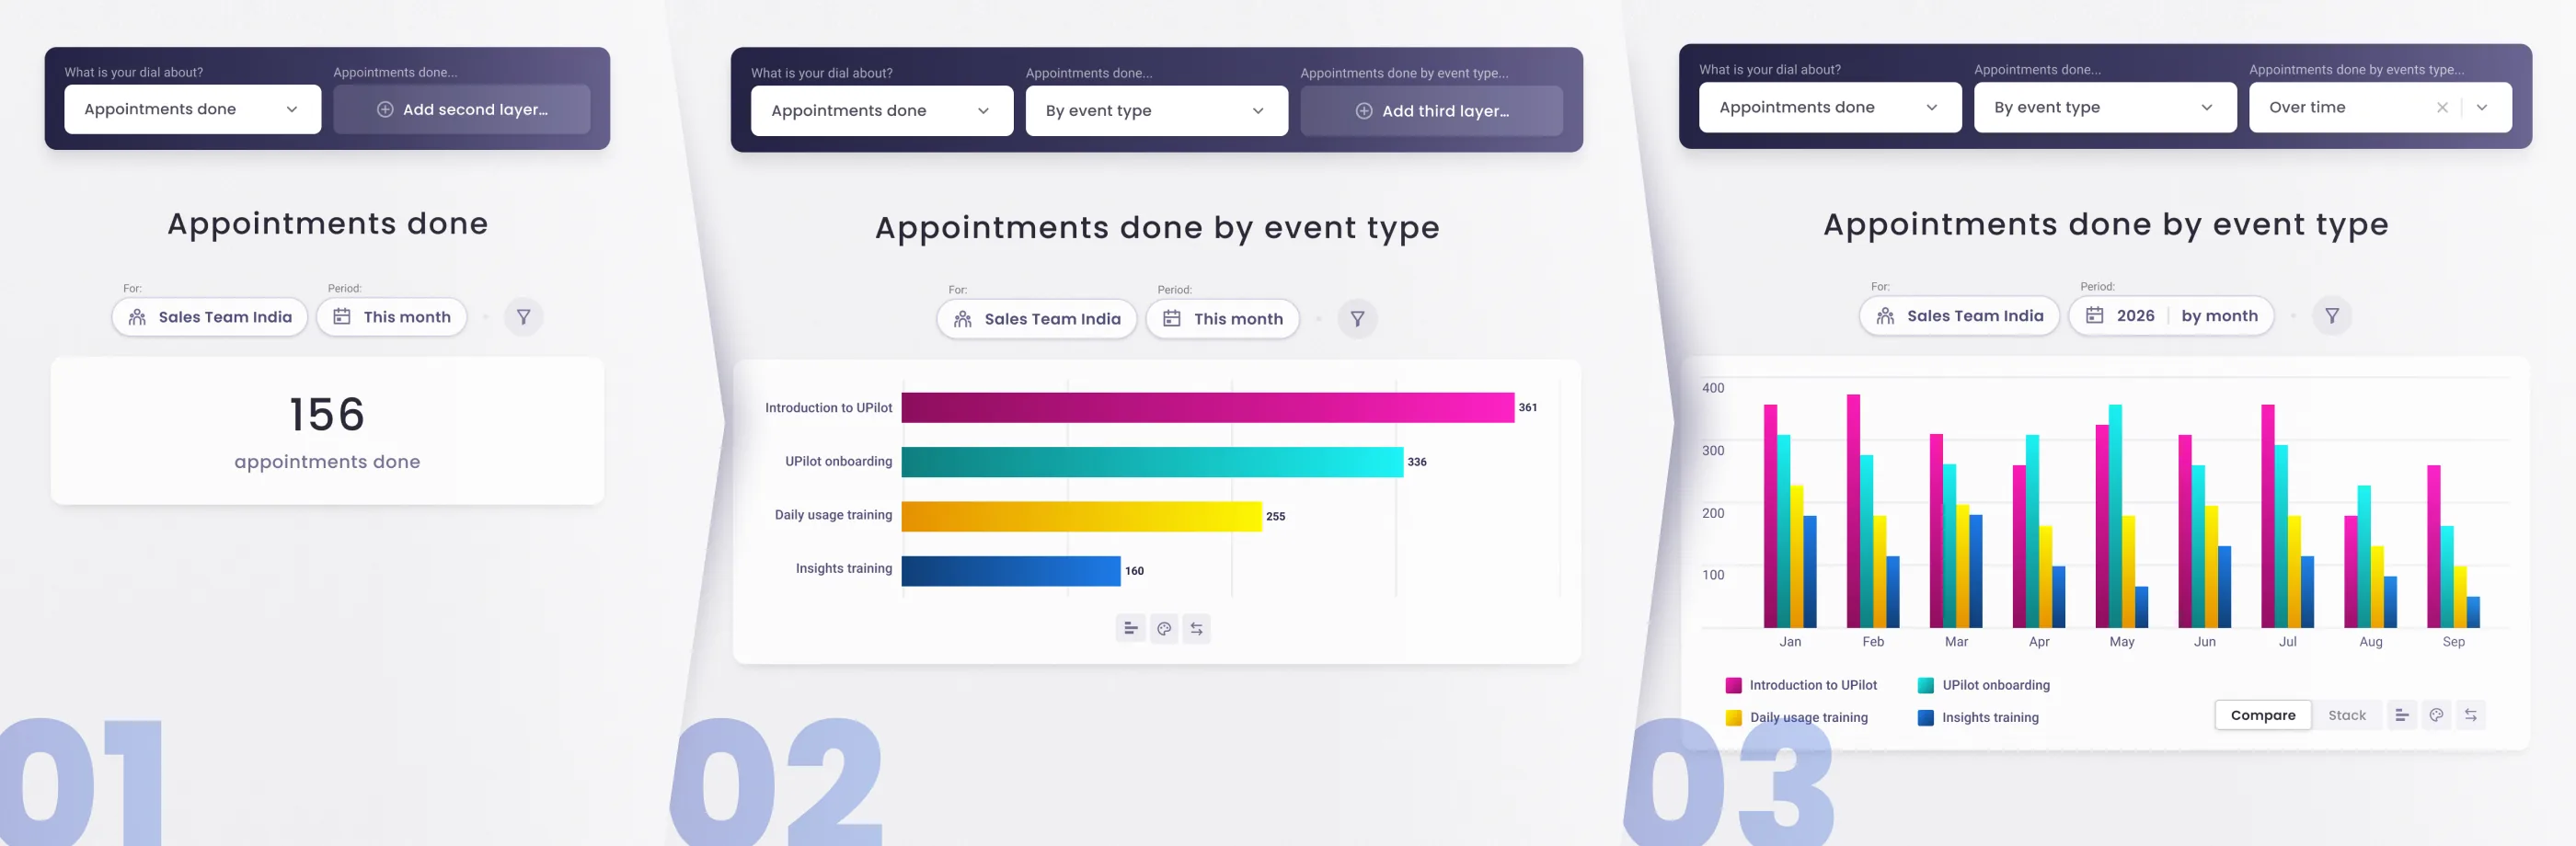
So I went with a guided path instead. One field at a time. You pick what you want to measure, revenue, or sales and forecast, or anything else in the CRM. Then you pick how to break it down. Then again, up to three levels deep. Revenue per salesperson per month. Revenue per category per month. Revenue per category per person.

To make sure nobody ever has to start from nothing, the guided path never shipped on its own. It came paired with reports already built and ready to use, and with a field where you ask in your own words and let UPilot assemble the report for you.

At every step the system puts the obvious options first and keeps every other option one dropdown away, custom fields included. It ranks, it does not restrict.

Together the two halves do what neither does alone. A ready-made report puts something useful on screen straight away. The guided path shows how that report was built, field by field, so you can carry it the rest of the way to the one you actually needed.

The same report built in three steps: the total on its own, then split by event type, then that same split spread month by month

Three ways in, one editor

Step by step, ready-made, or asked for in your own words: none of the three is a separate feature. They are the same editor at three levels of fill.

Pick a ready-made dashboard and you land in the editor, pre-filled, with your real data already in it, and every field open to change. Ask in your own words and UPilot proposes something, then drops you in exactly the same place. There is no dead end anywhere, and nothing you learn on one route is wasted on another.

The old catalogue did not disappear. It became the way in.

Reading the data as you build it

The data is on screen the whole time you are building. Change a field and everything under the chart moves with it, so you know straight away whether you asked the right thing. It saves the loop we kept seeing: configure, generate, realise it was not the right question, start again.

Two views sit under every chart, one toggle apart. The first is the same data as a table, often easier to read than the chart itself. The second lets you drill down into the records that built it, the deals or the contacts or whatever the report counted, and you can open any one of them.

That keeps the report attached to the work. You are never left with a figure you can only look at.

What the report is, and what goes into it

There are two dimensions at work, and telling them apart took some doing. The fields build the chart: what is measured and how it is broken down, the axes if you like. The filters decide which values are counted at all.

With no filter, everything counts. Add one and you are looking at a single team, a single product, one client or a group of them, and any field you can filter on will do. The shape of the report never changes. Only what goes into it does.

Goals get a system of their own

By type, by period, by individual or by group.

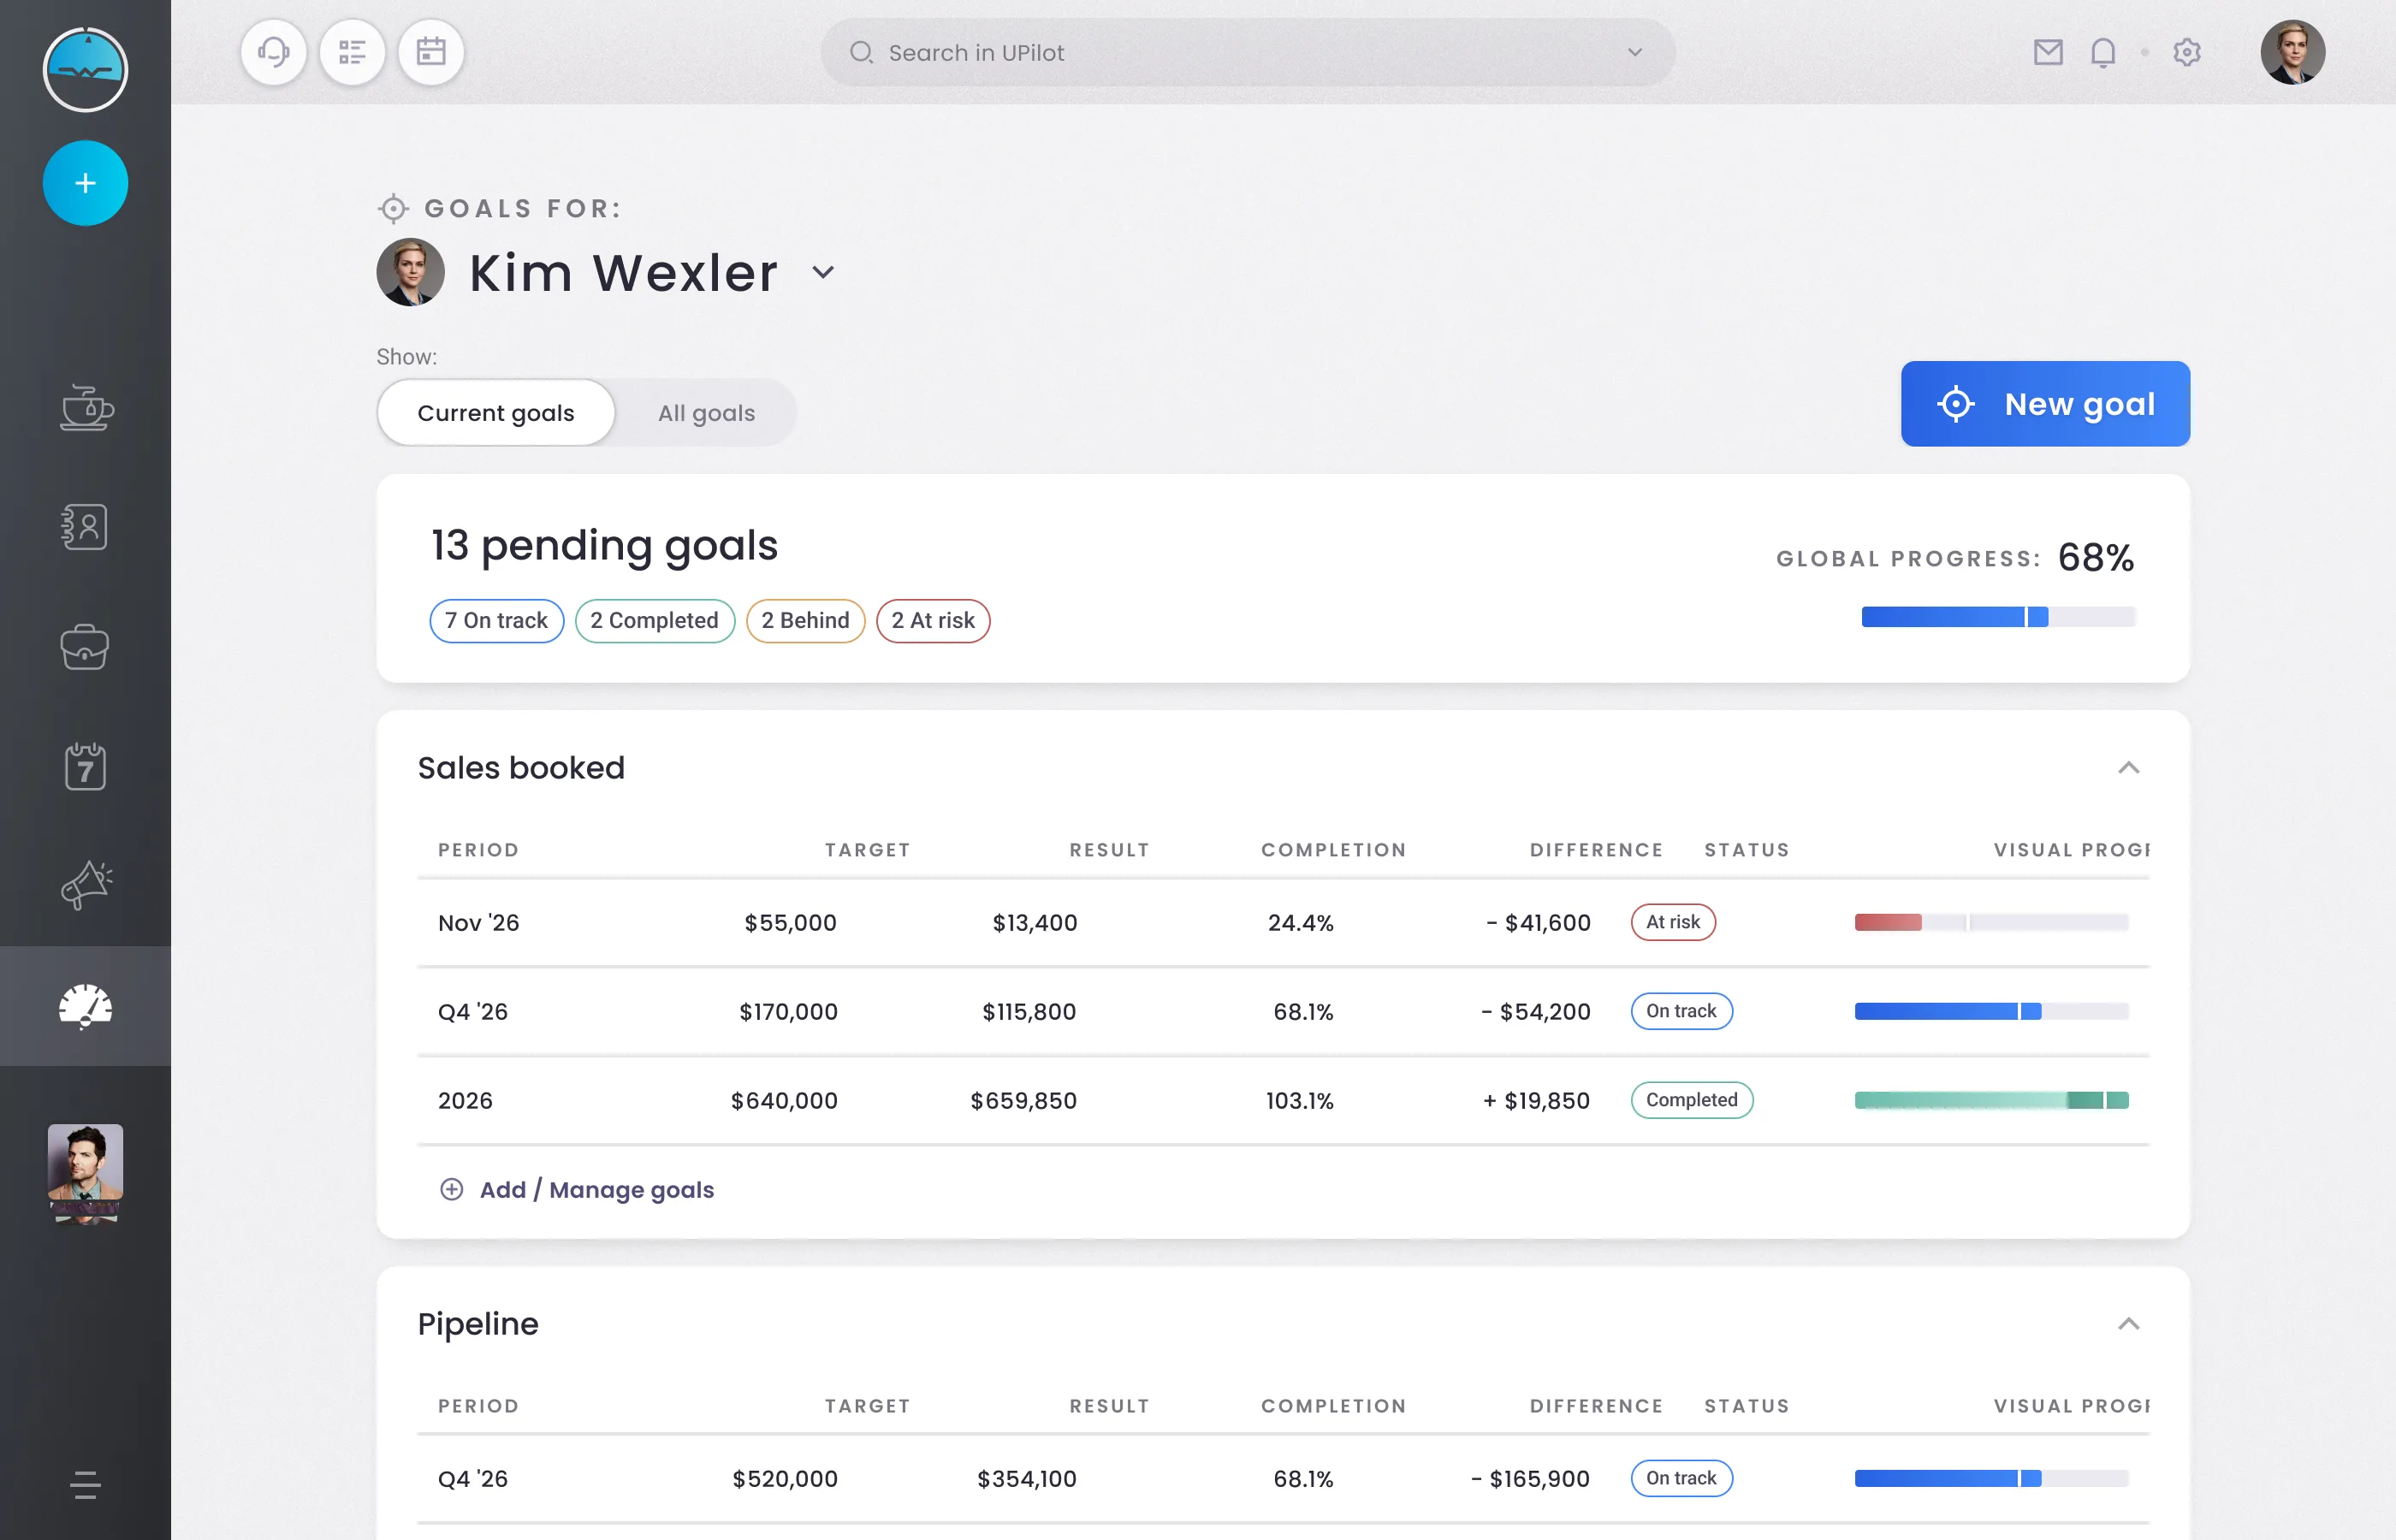
Revenue for one salesperson this month, deals closed for a whole team this quarter, a number that has to hold across the year. All of them are managed and tracked in one place, progress included.

Goals have their own system, and it is wired into the reports in both directions. Build sales booked per month over the year and the targets appear on it, hit or missed at a glance; set a target straight from that report and it goes back into the system. Nothing is entered twice, nothing is kept in sync by hand.

Kim Wexler’s goals screen: three deadlines for sales booked, each with its target, result, gap and progress bar

Roles, visibility and permissions

Report and goal data is among the most sensitive data in a CRM, and the bigger the company, the more that is true. Roles, visibility and permissions run across the whole product, and they set the limits of what anyone can read, and therefore of what anyone can build.

Most people never build a report. They read one, and what they can read is settled by their role, by the permissions and visibility attached to it, and by where they sit in the org chart.

Getting it accepted took longer than designing it

One challenging part of this project had nothing to do with the design, and I took something useful from it. The model was clear in my head. My wireframes were not, and to begin with nobody really read them.

It took explaining it in person, first to our head of customer success, then in a call where the question on the table happened to be how clients could build insights from their own custom fields. That was exactly what those wireframes answered, so I said so. Once the room actually looked at them, the model was obvious.

The answer I got back was fair, and I should have seen it myself: we understand it now that you have explained it, so go and design a UX that does not need explaining.

That is the version that shipped. And years later, when I wanted to turn the contact page into an account-based view, with a company, its contacts and its deals in one place, I did not argue for it. I built a working prototype and showed it. Nobody needed convincing.